Introduction of dbSNO 2.0
S-nitrosylation (SNO), a reversible post-translational modification in which nitric oxide is covalently attached to the sulfur of a cysteine residue. Given the increasing number of proteins reported to be regulated by this modification, S-nitrosylation is considered to act, in a manner analogous to phosphorylation, as a pleiotropic regulator that elicits dual effects to regulate diverse pathophysiological processes by altering protein function, stability, and conformation change in various cancers and human disorders. Due to its importance in regulating protein functions and cell signaling, dbSNO 2.0 (http://dbSNO.mbc.nctu.edu.tw) is extended as an informative resource for exploring structural environment of SNO substrate sites and regulatory networks of S-nitrosylated proteins. An increasing interest in the structural environment of PTM substrate sites motivated us to map all manually curated SNO peptides (4165 SNO sites within 2277 proteins) to PDB protein entries by sequence identity, which provides the information of spatial amino acid composition, solvent-accessible surface area, spatially neighboring amino acids, and side chain orientation for 298 substrate cysteine residues. Additionally, the annotations of protein molecular functions, biological processes, functional domains and human diseases are integrated to explore the functional and disease associations for S-nitrosoproteome. In this update, users are allowed to search a group of interested proteins/genes and the system reconstructs the S-nitrosylation regulatory network based on the information of metabolic pathways and protein-protein interactions. Most importantly, an endogenous yet pathophysiological S-nitrosoproteomic dataset from colorectal cancer patients was adopted to demonstrate that dbSNO could discover potential SNO proteins involving in the regulation of NO signaling for cancer pathways. The improvements and advances in dbSNO 2.0 are presented in Table 1. The updated dbSNO 2.0 is now freely accessible via http://dbsno.mbc.nctu.edu.tw/. The database is regularly updated upon collecting new data from continuously surveying research articles.
 Table 1. The improvements and advances in dbSNO 2.0 (Oct-10-2014).
| dbSNO 1.0 | dbSNO 2.0 | |
| Number of organisms | 18 | 18 |
| Number of cysteine S-nitrosylation instances | 3,374 | 4,777 |
| Number of S-nitrosylated proteins | 1,757 | 2,416 |
| Number of supported literatures | 219 | 281 |
| Number of in vivo SNO sites / proteins | - | 2,732 sites / 1,397 proteins |
| Number of in vitro SNO sites / proteins | - | 2,066 sites / 1,186 proteins |
| Substrate motif analysis | WebLogo | WebLogo, MDDLogo and TwoSampleLogo |
| Functional domain | - | InterPro |
| Structural characteristics of SNO sites | - | Spatial amino acid composition, solvent-accessible surface area, spatially neighboring amino acids, and side chain orientation |
| Protein-protein interaction | - | Over ten public PPI resources |
| Network analysis of SNO proteins | - | Network analysis with protein-protein interactions, KEGG, and human disease database |
| Network visualization | - | PHP GD library and Cytoscape package |
| Disease information | - | KEGG Disease database, OMIM, The Human Protein Atlas |
| Correlation between SNO and other types of PTM | - | Correlation network between SNO and other 13 PTM types |
Table 2. | dbSNO 2.0 | All | HUMAN | MOUSE | |||
| SNO proteins | SNO sites | SNO proteins | SNO sites | SNO proteins | SNO sites | |
| Endogenous (Basal level, mutation) |
759 (31.4%) |
1,691 (35.4%) |
104 (14.4%) |
187 (15.0%) |
605 (40.5%) |
1,448 (44.4%) |
| In vivo | 1,397 (57.8%) |
2,732 (57.2%) |
443 (61.5%) |
730 (58.4%) |
904 (60.5%) |
1,946 (59.7%) |
| In vitro | 1,186 (49.1%) |
2,066 (43.2%) |
199 (27.6%) |
265 (21.2%) |
873 (58.4%) |
1,641 (50.4%) |
| Total | 2,416 | 4,777 | 720 | 1,250 | 1,494 | 3,259 |
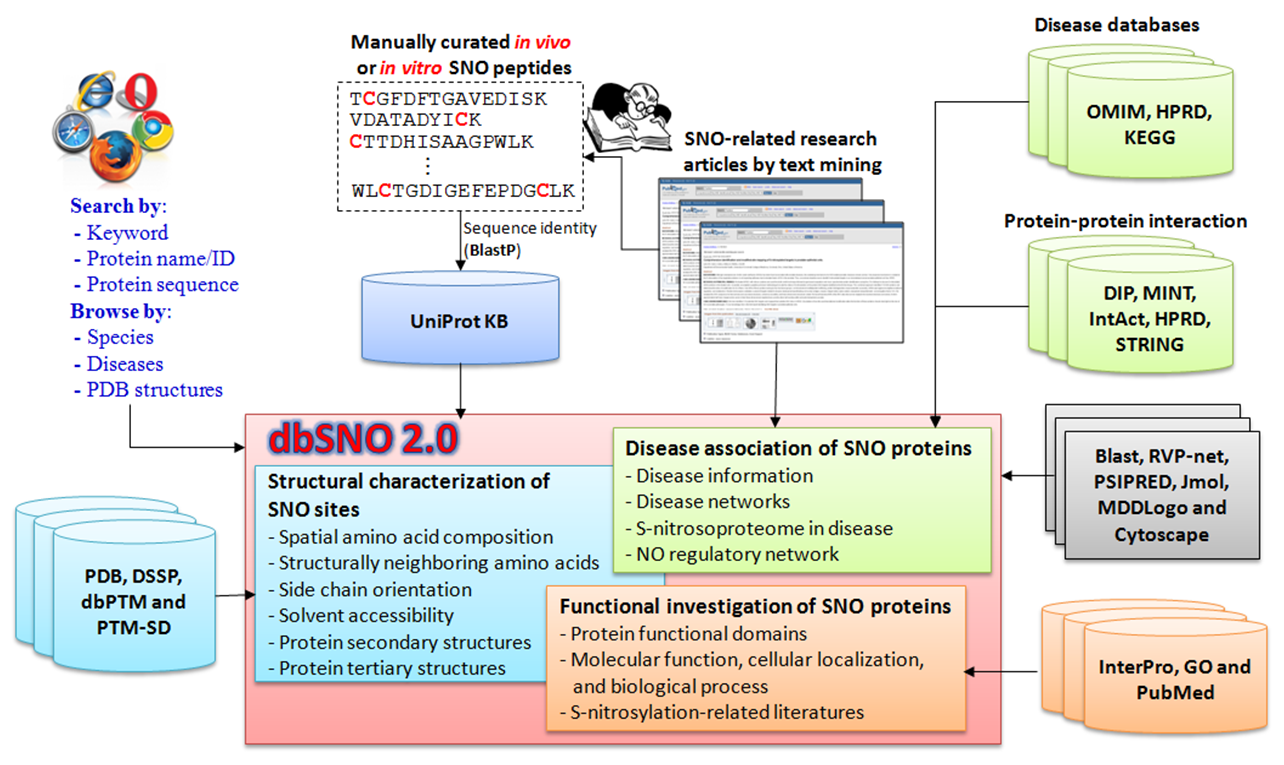
System Flow of dbSNO 2.0